 |
 |
 |
 |
 |
 |
 |
 |
 |
 |
 |
 |
 |
 |
 |
 |
 |
 |
 |
 |
 |
 |
 |
 |
Demographics: The demographic questions included in our survey included year in school, respective college (Liberal Arts and Sciences, Commerce etc), and GPA or grade point average. The results for each of these subsections are as follows:
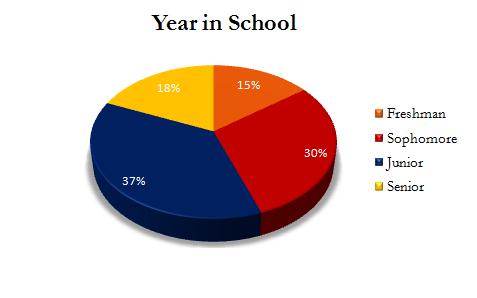
Year in School: Out of the 27 participants in our survey, 4 are freshman, a total of 14.8 percent. There are 8 sophomores, a total of 29.6 percent. The greatest numbers of participants are juniors, with 10 out of the total 27, making a total of 37 percent. There are 5 seniors, a total of 18.5 percent.
Respective Colleges at DePaul University: The overwhelming majority of participants in this survey belong to the college of commerce at DePaul. They comprise 16 out of the total 27 participants, 59.3 percent. Following this, 7 participants belong to the college of Liberal Arts and Sciences, 25.9 percent. 3 participants belong to the college of communication, 11.1 percent, and 1 participant belongs to the College of computing and digital media at DePaul, making it 3.7 percent.
GPA: We divided the grade point average into four categories: a GPA in the range of 4.0-3.5, then 3.5-3.0, 3.0-2.5, 2.5-2.0. There are 10 participants out of the total 27 with a GPA in the highest range of 4.0-3.5, this is 37 percent. There are 11 participants who fall into the following 3.5-3.0 range, making up 40.7 percent of the total. 7 of the participants have a GPA in the range of 3.0-2.5, 25.9 percent. There are no participants with a GPA in the range of 2.5-2.0.
Hypotheses: The demographic questions also corresponded with our hypotheses. We formulated three hypotheses before conducting the survey.
Hypothesis 1: DePaul Students use Google more than DePaul’s Library Database for research.
Hypothesis 2: DePaul’s juniors and seniors are more likely to use the library database than freshman and sophomores.
Hypothesis 3: DePaul student with a higher GPA (3.5 and above) are more likely to use the library databases than students with a lower GPA (2.0-3.0).
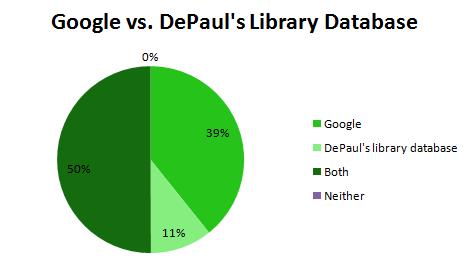
After collecting and then analyzing our survey results, it was clear that certain data related to each of the hypotheses. Our first hypothesis seemed more supported, and the problems with the others were clearer, once we factored in the free response answers (see “other results” section below). The first hypothesis specifically correlates with the question on our survey specifically asks which method students prefer using and the answer that received the most votes was “both,” meaning that the majority of students prefer using both Google and the library database. However, the second greatest number of students prefers to use Google. Therefore, we could somewhat support that overall Google was certainly preferred by almost all students that participated.

Our second hypothesis states that juniors and seniors are more likely to use the library database over freshman and sophomore students. We were not able to fully support this as we discovered that the majority of the students who participated in the survey were freshman and sophomore (see chart below). However, it did help to see each participant’s free response answer together with their other survey responses. Then we were able to see that those who had more specific answers about research and that seemed to spend longer hours researching were usually juniors.

Our third hypothesis states that students with a higher GPA are more likely to use the library databases. This had similar problems. We could not fully support this solely with our results due to the fact that the majority of participants have a relatively high GPA (see chart below) and we could not determine specifically who preferred what method.

Other Results:
The free response question we included in our survey asks, “Overall what does most of the research you do pertain to and how serious do you take it? This question made it clear that the majority of participants do prefer to use Google when doing research because even those that answered that they prefer using both seemed to have strong reasons for using Google making it clear that it was a preferred supplement or the main factor in their research. In addition, the free response also gave us the opportunity to see who had answered that they took the credibility of sources more seriously and how many hours they spent doing research, which both usually share a connection with library database research. However, to truly support this hypothesis we should have had another free response question asking the students why they preferred one over the other and possibly something concerning their GPA or year to give us opportunity for more detailed analysis.
Revised: 5/30/10